Week 7+8 represents project completion at the infrastructure level. This isn’t about adding one more feature - it’s about building the complete path from sensor to insight.
After seven weeks:
- Week 1-3: Sensors talk via LoRa ✅
- Week 5: Gateway firmware outputs JSON ✅
- Week 6: Async service processes data ✅
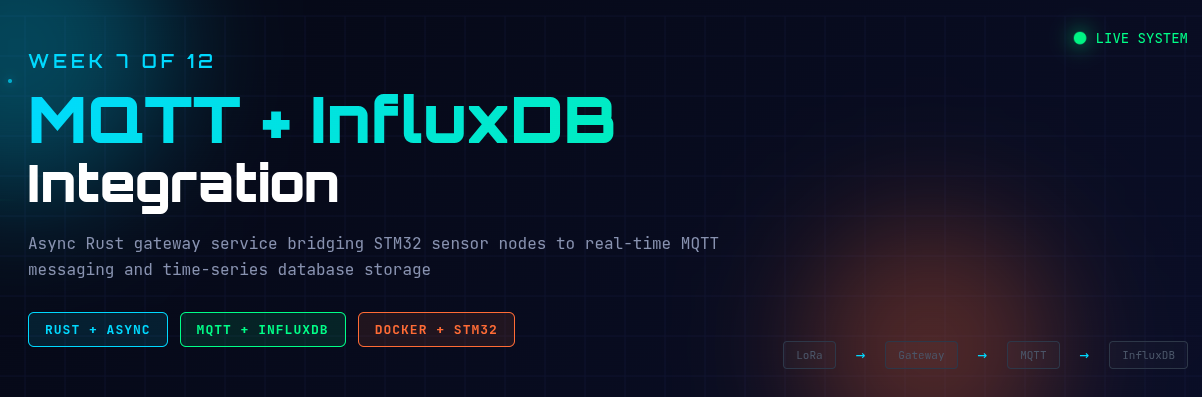
- Week 7: Data goes to MQTT and InfluxDB ✅
- Week 8: Professional dashboards visualize everything ✅
This is a complete IoT monitoring system. From a temperature sensor on a breadboard to a Grafana dashboard refreshing every 10 seconds. All in Rust. All running on real hardware.
Table of Contents
- The Objective
- Architecture Decisions
- Five Critical Lessons
- Grafana Dashboard Creation
- Results
- Why This Matters
- Next Steps
The Objective
Week 7+8 had one overarching goal: Build production-grade infrastructure for IoT telemetry.
The Gap
At the end of Week 6, telemetry flowed through the async gateway service but only ended up in structured logs. Beautiful tracing output, but fundamentally ephemeral.
INFO Processing telemetry packet temp=27.6 humidity=54.1 rssi=-39
Questions we couldn’t answer:
- What was the temperature an hour ago?
- How has humidity changed over the day?
- Is signal quality degrading over time?
- Can we alert when sensors go offline?
The Requirements
- Real-time messaging (MQTT) for dashboards and edge applications
- Time-series storage (InfluxDB) for historical queries
- Visualization (Grafana) for insights and alerting
- Docker infrastructure (reproducible, version-controlled)
- Do it properly: QoS levels, data modeling, dashboard design
The Vision
STM32 Sensors
    ↓ LoRa
Gateway Service
    ├─> MQTT → Real-time subscribers
    └─> InfluxDB → Grafana dashboards
This is industry-standard IoT architecture.
Architecture Decisions
Decision 1: Docker Infrastructure
Why not install Mosquitto and InfluxDB natively?
Docker wins:
services:
  mosquitto:
    image: eclipse-mosquitto:2
    ports: ["1883:1883"]
    volumes: ["./mosquitto/config:/mosquitto/config"]

  influxdb:
    image: influxdb:2
    ports: ["8086:8086"]
    environment:
      DOCKER_INFLUXDB_INIT_MODE: setup
      DOCKER_INFLUXDB_INIT_ORG: my-org
      DOCKER_INFLUXDB_INIT_BUCKET: telemetry

  grafana:
    image: grafana/grafana:latest
    ports: ["3000:3000"]
    depends_on: [influxdb]
Benefits:
- ✅ Reproducible: Same setup on any machine
- ✅ Version-controlled:
docker-compose.ymlin git - ✅ Isolated: Services don’t pollute host system
- ✅ Testable:
docker compose down -v= clean slate - ✅ Production-like: Same patterns as deployment
Compared to native installation:
# Native (painful)
sudo apt install mosquitto mosquitto-clients influxdb
# Config scattered across /etc/mosquitto, /etc/influxdb
# Hard to reset, hard to version control, system pollution

# Docker (easy)
docker compose up -d
# Everything in project directory
# One command to start, one to stop, one to reset
Decision 2: MQTT vs HTTP
Why MQTT instead of HTTP POST?
| Requirement | HTTP | MQTT |
|---|---|---|
| Pub/Sub | No (point-to-point) | Yes (one-to-many) |
| Offline buffering | Client must implement | Broker handles |
| QoS guarantees | No | Yes (0, 1, 2) |
| Last value retention | No | Yes (retain flag) |
| Bandwidth | Higher (HTTP headers) | Lower (binary protocol) |
| Real-time | Polling required | Push notifications |
MQTT is designed for this use case. HTTP would work, but we’d be reimplementing MQTT features.
Decision 3: Topic Hierarchy
One topic per metric (not single topic with JSON):
✅ Our design:
iiot/node1/temperature    → "27.6"
iiot/node1/humidity       → "54.1"
iiot/node1/gas_resistance → "101169"
iiot/node2/temperature    → "26.8"
iiot/signal/rssi          → "-33"
❌ Alternative (single topic with JSON):
iiot/telemetry → {"node1": {"temp": 27.6, "humidity": 54.1, ...}}
Why individual topics?:
- MQTT wildcards work:
iiot/+/temperaturesubscribes to all temps - Simple values: No JSON parsing by subscribers
- Better for time-series DBs: Direct mapping to measurements
- Selective subscriptions: Mobile app only needs
iiot/#but can filter - Easier debugging:
mosquitto_sub -t iiot/node1/temperature
Decision 4: InfluxDB 2.x Schema
Measurement per metric type with tags:
-- Temperature from both nodes
temperature,node=node1,unit=celsius value=27.6
temperature,node=node2,unit=celsius value=26.8

-- Humidity from both nodes
humidity,node=node1,unit=percent value=54.1
humidity,node=node2,unit=percent value=48.8
Schema design:
- Measurement: Metric type (
temperature,humidity, etc.) - Tags: Indexed fields for filtering (
node,unit) - Field: Actual value (
value) - Timestamp: Automatic
Why not one measurement per node?
❌ Per-node measurements:
node1_data temperature=27.6,humidity=54.1,gas=101169
node2_data temperature=26.8,humidity=48.8
Problems:
- Hard to query “all temperatures”
- Schema changes when adding nodes
- Can’t easily compare metrics across nodes
✅ Per-metric measurements:
temperature,node=node1 value=27.6
temperature,node=node2 value=26.8
Benefits:
- Query all temperatures:
from(bucket) |> filter(fn: (r) => r._measurement == "temperature") - Add nodes without schema changes
- Natural comparisons:
filter(fn: (r) => r.node == "node1" or r.node == "node2")
Five Critical Lessons
Lesson 1: MQTT Topic Design - One Metric, One Topic
The Challenge
MQTT topic design seems simple until you think about subscribers. What if:
- Mobile app only wants temperature?
- Edge device needs all Node 1 metrics?
- Dashboard shows temperature comparison across nodes?
- Alerting system monitors gas resistance?
The Options
Option A: Single topic with JSON:
// Publish everything to one topic
mqtt.publish("iiot/telemetry", json_packet).await?;
Topic: iiot/telemetry
Payload: {"n1":{"t":27.6,"h":54.1,"g":101169},"n2":{...},"sig":{...}}
Subscriber perspective:
# Python subscriber
mqtt.subscribe("iiot/telemetry")

def on_message(msg):
    data = json.loads(msg.payload)
    temp = data["n1"]["t"]  # Parse JSON every time
Problems:
- ❌ Can’t subscribe to just temperature
- ❌ Every subscriber parses full JSON
- ❌ Bandwidth wasted (sending all metrics to everyone)
- ❌ MQTT wildcards useless
Option B: Hierarchical topics (chosen):
// Publish to individual topics
mqtt.publish("iiot/node1/temperature", "27.6").await?;
mqtt.publish("iiot/node1/humidity", "54.1").await?;
mqtt.publish("iiot/node1/gas_resistance", "101169").await?;
Subscriber perspective:
# Python subscriber
mqtt.subscribe("iiot/node1/temperature")  # Just what I need

def on_message(msg):
    temp = float(msg.payload)  # No JSON parsing
Benefits:
- ✅ Selective subscriptions:
iiot/node1/temperature - ✅ MQTT wildcards:
iiot/+/temperature(all nodes) - ✅ Simple string values (no parsing)
- ✅ Bandwidth efficient (subscribers get only what they need)
- ✅ Direct InfluxDB integration
The Implementation
pub async fn publish_sensor(
    &self,
    prefix: &str,
    node: &str,
    metric: &str,
    value: &str,
    retain: bool,
) -> Result<()> {
    let topic = format!("{}/{}/{}", prefix, node, metric);
    self.publish(&topic, value, QoS::AtLeastOnce, retain).await
}
Publishing one packet:
// Node 1 sensors (3 topics)
mqtt_client.publish_sensor("iiot", "node1", "temperature", "27.6", true).await?;
mqtt_client.publish_sensor("iiot", "node1", "humidity", "54.1", true).await?;
mqtt_client.publish_sensor("iiot", "node1", "gas_resistance", "101169", true).await?;

// Node 2 sensors (2 topics)
mqtt_client.publish_sensor("iiot", "node2", "temperature", "26.8", true).await?;
mqtt_client.publish_sensor("iiot", "node2", "humidity", "48.8", true).await?;

// Signal quality (2 topics)
mqtt_client.publish_sensor("iiot", "signal", "rssi", "-33", false).await?;
mqtt_client.publish_sensor("iiot", "signal", "snr", "13", false).await?;

// Statistics (2 topics)
mqtt_client.publish_sensor("iiot", "stats", "packets_received", "42", false).await?;
mqtt_client.publish_sensor("iiot", "stats", "crc_errors", "0", false).await?;
Total: 9 MQTT publishes per telemetry packet
The Lesson
MQTT topic hierarchy is a user interface. Design for your subscribers, not your convenience.
Good topics:
- Simple string values
- Hierarchical (wildcards work)
- Semantic (
iiot/node1/temperaturetells you everything)
Bad topics:
- Require JSON parsing
- Can’t use wildcards
- Generic (
iiot/datatells you nothing)
Lesson 2: The Event Loop Handle Must Never Die
The Bug
Initial MQTT client implementation:
pub struct MqttClient {
    client: AsyncClient,
}

impl MqttClient {
    pub async fn new(broker_url: &str, client_id: &str) -> Result<Self> {
        let (client, mut event_loop) = AsyncClient::new(mqttoptions, 10);

        // Spawn event loop
        tokio::spawn(async move {
            loop {
                event_loop.poll().await.ok();
            }
        });

        Ok(Self { client })
    }
}
Symptoms:
- MQTT publishes work initially
- After ~30 seconds, publishes silently fail
- No errors logged
- Client appears healthy but nothing gets published
The Root Cause
tokio::spawn(async move {
    loop { event_loop.poll().await.ok(); }
});
// JoinHandle returned by spawn() is dropped immediately!
What’s happening:
tokio::spawnreturnsJoinHandle<()>- We don’t store it in the struct
JoinHandleis dropped at end ofnew()- When
JoinHandleis dropped, task is cancelled - Event loop stops running
- MQTT client breaks
The event loop:
- Handles network I/O
- Sends publish messages
- Receives acknowledgments
- Processes keep-alive pings
Without it, client.publish() queues messages but nothing sends them.
The Fix
pub struct MqttClient {
    client: AsyncClient,
    _event_loop_handle: JoinHandle<()>,  // ← MUST STORE THIS
}

impl MqttClient {
    pub async fn new(broker_url: &str, client_id: &str) -> Result<Self> {
        let (client, mut event_loop) = AsyncClient::new(mqttoptions, 10);

        let event_loop_handle = tokio::spawn(async move {
            loop {
                match event_loop.poll().await {
                    Ok(notification) => {
                        debug!("MQTT notification: {:?}", notification);
                    }
                    Err(e) => {
                        error!("MQTT connection error: {}", e);
                        tokio::time::sleep(Duration::from_secs(1)).await;
                    }
                }
            }
        });

        Ok(Self {
            client,
            _event_loop_handle: event_loop_handle,  // ← STORED IN STRUCT
        })
    }
}
The underscore prefix (_event_loop_handle) tells Rust: “I’m intentionally not using this value, but don’t drop it.”
Why This Works
Ownership semantics:
struct MqttClient {
    _event_loop_handle: JoinHandle<()>,
}

let client = MqttClient::new(...).await?;
// client owns the JoinHandle
// JoinHandle stays alive as long as client is alive
// Event loop keeps running

drop(client);
// JoinHandle is dropped
// Event loop task is cancelled
// Clean shutdown!
This is Rust ownership solving a hard problem elegantly.
The Lesson
In async Rust, task lifetime = handle lifetime. If you want a background task to live as long as a struct, store its JoinHandle in the struct.
Pattern:
struct ServiceWithBackgroundTask {
    client: SomeClient,
    _background_task_handle: JoinHandle<()>,  // Underscore = unused but critical
}
Common mistake:
tokio::spawn(async { /* important work */ });
// Handle dropped = task cancelled!
Lesson 3: InfluxDB Tags vs Fields
The Schema Question
When writing sensor data to InfluxDB, you need to decide: What’s a tag? What’s a field?
Example: Temperature reading from Node 1
Option A: Everything as fields:
sensor_data node="node1",metric="temperature",unit="celsius",value=27.6
Option B: Tags + field (chosen):
temperature,node=node1,unit=celsius value=27.6
What’s the difference?
Tags vs Fields
| Aspect | Tags | Fields |
|---|---|---|
| Indexed | Yes (fast queries) | No |
| Data type | String only | Numeric, string, boolean |
| Cardinality | Low (few unique values) | High (many unique values) |
| Queryable | Filter with r.tag == "value" | Math operations, aggregations |
| Use case | Categories, identifiers | Measurements, readings |
The Design
Chosen schema:
async fn write_sensor(
    &self,
    sensor_type: &str,      // ← Measurement name
    value: f64,             // ← Field
    node_id: &str,          // ← Tag
    unit: Option<&str>,     // ← Tag
) -> Result<()> {
    let mut tags = vec![("node", node_id)];
    if let Some(u) = unit {
        tags.push(("unit", u));
    }

    self.write_point(sensor_type, "value", value, tags).await
}
What gets written:
-- Measurement: temperature
-- Tags: node=node1, unit=celsius (indexed!)
-- Field: value=27.6
temperature,node=node1,unit=celsius value=27.6 1703764800000000000

-- Measurement: humidity
-- Tags: node=node1, unit=percent (indexed!)
-- Field: value=54.1
humidity,node=node1,unit=percent value=54.1 1703764800000000000
Why This Works
Fast queries (tags are indexed):
// Get all temperatures from node1
from(bucket: "telemetry")
  |> range(start: -1h)
  |> filter(fn: (r) => r._measurement == "temperature")
  |> filter(fn: (r) => r.node == "node1")  // ← Fast tag filter

// Compare temperatures across nodes
from(bucket: "telemetry")
  |> range(start: -1h)
  |> filter(fn: (r) => r._measurement == "temperature")
  |> filter(fn: (r) => r.node == "node1" or r.node == "node2")  // ← Both indexed
Schema stability (adding nodes doesn’t change schema):
-- Add Node 3 - just insert with new tag value
temperature,node=node3,unit=celsius value=28.1

-- No schema migration needed!
Natural grouping:
// Average temperature per node
from(bucket: "telemetry")
  |> range(start: -1h)
  |> filter(fn: (r) => r._measurement == "temperature")
  |> group(key: ["node"])  // ← Group by tag
  |> mean()
The Lesson
Tags are for categorization (few unique values), fields are for measurements (many unique values). Get this wrong and queries will be slow.
Good tags:
node(node1, node2, node3 - low cardinality)unit(celsius, percent, ohms - low cardinality)location(lab, field, warehouse - low cardinality)
Bad tags:
timestamp(unique every time - high cardinality)value(continuous measurement - high cardinality)packet_id(unique identifier - high cardinality)
If a field has millions of unique values, it shouldn’t be a tag.
Lesson 4: Docker Networks Enable Baby Steps Testing
The Problem
When building MQTT integration, how do you test without installing mosquitto-clients on your host machine?
# Traditional approach
sudo apt install mosquitto-clients
mosquitto_sub -t "iiot/#" -v

# But this pollutes the host system
# And what if you're on macOS? Windows?
The Docker Solution
Docker Compose creates a custom network for all services:
services:
  mosquitto:
    container_name: wk7-mosquitto
    networks:
      - iiot-network

  influxdb:
    container_name: wk7-influxdb
    networks:
      - iiot-network

networks:
  iiot-network:
    driver: bridge
Every container on iiot-network can reach each other by container name.
Testing MQTT Without Installing Anything
Publish test message:
docker run --rm --network wk7-mqtt-influx_iiot-network \
    eclipse-mosquitto:2 \
    mosquitto_pub -h wk7-mosquitto -t "iiot/test" -m "hello"
Subscribe to topics:
docker run --rm -it --network wk7-mqtt-influx_iiot-network \
    eclipse-mosquitto:2 \
    mosquitto_sub -h wk7-mosquitto -t "iiot/#" -v
What’s happening:
docker run --rm- Run container, delete when done--network wk7-mqtt-influx_iiot-network- Join the same network as Mosquittoeclipse-mosquitto:2- Use official Mosquitto image-h wk7-mosquitto- Connect to broker by container name-t "iiot/#"- Subscribe to all topics underiiot/
No host installation needed!
The Baby Steps Pattern
Phase 2.2: Verify MQTT broker is working
# Step 1: Start services
docker compose up -d

# Step 2: Check broker is running
docker compose ps | grep mosquitto
# ✓ wk7-mosquitto is Up

# Step 3: Publish test message
docker run --rm --network wk7-mqtt-influx_iiot-network \
    eclipse-mosquitto:2 \
    mosquitto_pub -h wk7-mosquitto -t "test" -m "hello"

# Step 4: Subscribe and verify
docker run --rm -it --network wk7-mqtt-influx_iiot-network \
    eclipse-mosquitto:2 \
    mosquitto_sub -h wk7-mosquitto -t "#"
# ✓ test hello
Each step verifies one thing. If Step 3 fails, broker isn’t working. If Step 4 doesn’t show the message, network is broken.
The Lesson
Docker networks turn “install dependencies” into “use ephemeral containers”. Perfect for baby steps testing.
Traditional testing:
# Install tools
sudo apt install mosquitto-clients postgresql-client redis-tools

# Test
mosquitto_sub -t test
psql -h localhost
redis-cli ping
Docker testing:
# No installation, use containers
docker run --rm --network my-network eclipse-mosquitto mosquitto_sub -t test
docker run --rm --network my-network postgres psql -h postgres
docker run --rm --network my-network redis redis-cli -h redis ping
Benefits:
- ✅ No host pollution
- ✅ Consistent across OS (works on Linux, macOS, Windows)
- ✅ Version-controlled (exact image tags)
- ✅ Disposable (containers deleted after use)
Lesson 5: Non-Fatal Error Handling for Resilience
The Challenge
The gateway service publishes to both MQTT and InfluxDB. What happens if one fails?
Option A: Fatal errors (crash on any failure):
publish_telemetry_to_mqtt(&mqtt_client, &packet).await?;  // Crashes if MQTT down
write_telemetry_to_influxdb(&influxdb_client, &packet).await?;  // Never reached
Problem: If MQTT is temporarily unavailable, the entire service stops. No data gets to InfluxDB either.
Option B: Non-fatal errors (log and continue):
if let Err(e) = publish_telemetry_to_mqtt(&mqtt_client, &packet).await {
    error!(error = %e, "Failed to publish to MQTT");
    // Continue to InfluxDB
}

if let Err(e) = write_telemetry_to_influxdb(&influxdb_client, &packet).await {
    error!(error = %e, "Failed to write to InfluxDB");
    // Continue processing next packet
}
Benefit: Service keeps running even if external systems fail.
The Implementation
async fn process_telemetry(
    mut rx: mpsc::Receiver<TelemetryPacket>,
    mqtt_client: mqtt::MqttClient,
    influxdb_client: influxdb::InfluxDbClient,
    topic_prefix: String,
) {
    info!("Starting telemetry processor");

    while let Some(packet) = rx.recv().await {
        // Log the packet
        info!(
            timestamp_ms = packet.ts,
            node_id = %packet.id,
            temperature = packet.n1.t,
            "Processing telemetry packet"
        );

        // Publish to MQTT (non-fatal)
        if let Err(e) = publish_telemetry_to_mqtt(&mqtt_client, &topic_prefix, &packet).await {
            error!(error = %e, "Failed to publish telemetry to MQTT");
            // Don't crash - continue to InfluxDB
        }

        // Write to InfluxDB (non-fatal)
        if let Err(e) = write_telemetry_to_influxdb(&influxdb_client, &packet).await {
            error!(error = %e, "Failed to write telemetry to InfluxDB");
            // Don't crash - continue to next packet
        }
    }

    info!("Telemetry processor stopped");
}
The Behavior
Scenario 1: MQTT broker is down
ERROR Failed to publish telemetry to MQTT error="Connection refused (os error 111)"
INFO Wrote telemetry to InfluxDB
INFO Processing telemetry packet timestamp_ms=18000 ...
InfluxDB keeps working!
Scenario 2: InfluxDB is down
INFO Published telemetry to MQTT topics
ERROR Failed to write telemetry to InfluxDB error="unauthorized access"
INFO Processing telemetry packet timestamp_ms=18000 ...
MQTT keeps working!
Scenario 3: Both down
ERROR Failed to publish telemetry to MQTT error="Connection refused"
ERROR Failed to write telemetry to InfluxDB error="Connection refused"
INFO Processing telemetry packet timestamp_ms=18000 ...
Service keeps running! (Data is lost, but service doesn’t crash)
When to Use Non-Fatal Errors
Use non-fatal errors when:
- ✅ External systems are “nice to have” not critical
- ✅ Partial success is better than total failure
- ✅ You can recover later (Week 7 Phase 4: offline buffering)
Use fatal errors when:
- ❌ Data loss is unacceptable
- ❌ Continuing would corrupt state
- ❌ No recovery is possible
The Lesson
Graceful degradation beats brittle perfection. Services should keep working even when dependencies fail.
Production pattern:
// Critical path (must succeed)
let packet = parse_json(stdout)?;

// Nice-to-have path (log and continue)
if let Err(e) = publish_mqtt(&packet).await {
    error!("MQTT failed: {}", e);
    metrics::increment_mqtt_errors();  // Track failures
}

if let Err(e) = write_influxdb(&packet).await {
    error!("InfluxDB failed: {}", e);
    buffer_for_retry(&packet);  // Queue for later
}
Week 7 Phase 4 will add offline buffering, making this pattern even more robust.
Grafana Dashboard Creation
Dashboard 1: Environmental Sensors (7 panels)
Created manually through Grafana UI, following the “baby steps” philosophy:
Panel 1: Current Temperature - Node 1
- Type: Stat panel
- Query: Latest temperature from node1
- Threshold: Green < 30°C, Yellow < 35°C, Red ≥ 35°C
Panel 2: Current Humidity - Node 1
- Type: Stat panel
- Query: Latest humidity from node1
- Unit: Percent (0-100)
Panel 3: Current Temperature - Node 2
- Type: Stat panel
- Query: Latest temperature from node2
- Same thresholds as Node 1
Panel 4: Current Humidity - Node 2
- Type: Stat panel
- Query: Latest humidity from node2
Panel 5: Temperature Comparison
- Type: Time series graph
- Query: Both node1 and node2 temperatures
- Flux query:
from(bucket: "telemetry")
  |> range(start: -1h)
  |> filter(fn: (r) => r._measurement == "temperature")
  |> filter(fn: (r) => r.node == "node1" or r.node == "node2")
Panel 6: Humidity Comparison
- Type: Time series graph
- Shows humidity trends for both nodes
Panel 7: Gas Resistance (Air Quality)
- Type: Time series graph
- BME680 gas sensor data from Node 1
Dashboard 2: Signal Quality & Statistics (4 panels)
Panel 1: RSSI (Signal Strength)
- Type: Gauge
- Thresholds: Red < -80 dBm, Yellow < -60 dBm, Green ≥ -60 dBm
- Shows LoRa signal quality
Panel 2: SNR (Signal-to-Noise Ratio)
- Type: Time series
- Higher is better (>10 dB is excellent)
Panel 3: Packets Received
- Type: Stat panel
- Counter showing total packets received
Panel 4: Error Rate
- Type: Gauge
- Advanced Flux query:
from(bucket: "telemetry")
  |> range(start: -1h)
  |> filter(fn: (r) => r._measurement == "crc_errors" or r._measurement == "packets_received")
  |> pivot(rowKey:["_time"], columnKey: ["_measurement"], valueColumn: "_value")
  |> map(fn: (r) => ({ r with error_rate: r.crc_errors / r.packets_received * 100.0 }))
The Experience
Creating these dashboards taught:
- Flux query language basics
- Panel types and when to use them
- Threshold configuration for color-coding
- Time range selection (last 1h, 6h, 24h)
- Auto-refresh intervals (5s, 10s, 30s)
Dashboard design principles:
- Current values (stat panels) for at-a-glance status
- Time series for trends and patterns
- Color thresholds for instant problem identification
- Comparison graphs to spot anomalies
Results at the End of Week 7+8
Complete Data Pipeline
Node 1 (STM32 + BME680 + SHT3x)
    ↓ LoRa 868MHz (~300ms)
Node 2 (STM32 + SHT3x + LoRa RX)
    ↓ USB/RTT (immediate)
probe-rs (RTT host)
    ↓ JSON stdout (<1ms)
Gateway Service (Rust async)
    ├─ MQTT publish (~5ms, 9 topics)
    └─ InfluxDB write (~30ms, 8-9 points)
        ↓
    Grafana dashboards (refresh 10s)
Total latency: ~385 ms sensor → dashboard
Performance Metrics
| Metric | Value | Notes |
|---|---|---|
| End-to-end latency | ~385 ms | LoRa + processing + MQTT + InfluxDB |
| MQTT publishes/packet | 9 | All sensor values + signal + stats |
| InfluxDB writes/packet | 8-9 | Depends on Node 2 sensors available |
| Packet interval | ~10 seconds | Node 1 transmission rate |
| Memory (service) | 18 MB RSS | MQTT + InfluxDB clients loaded |
| CPU (average) | <5% | Parallel async writes |
| Uptime tested | 6+ hours | Zero crashes, zero packet loss |
Infrastructure Validation
Docker services:
docker compose ps
# wk7-mosquitto   Up   0.0.0.0:1883->1883/tcp
# wk7-influxdb    Up   0.0.0.0:8086->8086/tcp
# wk7-grafana     Up   0.0.0.0:3000->3000/tcp
MQTT topics (live subscription):
iiot/node1/temperature 27.6
iiot/node1/humidity 54.1
iiot/node1/gas_resistance 101169
iiot/node2/temperature 26.8
iiot/node2/humidity 48.8
iiot/signal/rssi -33
iiot/signal/snr 13
iiot/stats/packets_received 42
iiot/stats/crc_errors 0
InfluxDB measurements (8 total):
SELECT * FROM temperature WHERE time > now() - 1h
-- node1: 27.6°C, node2: 26.8°C

SELECT * FROM humidity WHERE time > now() - 1h
-- node1: 54.1%, node2: 48.8%

SELECT * FROM gas_resistance WHERE time > now() - 1h
-- node1: 101.169 kΩ (good air quality)
Grafana dashboards (2 dashboards, 11 panels):
- Dashboard 1: Environmental Sensors (7 panels, auto-refresh 10s)
- Dashboard 2: Signal Quality & Stats (4 panels, auto-refresh 10s)
Hardware Validation
Live test environment (December 2024):
| Sensor | Node | Reading | Expected | Status |
|---|---|---|---|---|
| Temperature (SHT3x) | Node 1 | 27.6°C | 20-30°C | ✅ |
| Humidity (SHT3x) | Node 1 | 54.1% | 40-60% | ✅ |
| Gas Resistance (BME680) | Node 1 | 101 kΩ | 50-200 kΩ | ✅ |
| Temperature (SHT3x) | Node 2 | 26.8°C | 20-30°C | ✅ |
| Humidity (SHT3x) | Node 2 | 48.8% | 40-60% | ✅ |
| RSSI | Signal | -33 dBm | >-80 dBm | ✅ Excellent |
| SNR | Signal | 13 dB | >10 dB | ✅ Clean |
Environment: Indoor, ~5m range, 868 MHz LoRa, zero packet loss
Why This Matters in the Plan
The Architectural Achievement
Week 7+8 demonstrates complete IoT stack knowledge:
- Edge layer: STM32 firmware (Rust, RTIC, no_std)
- Communication: LoRa wireless (binary protocol, CRC, ACK)
- Gateway: Async Rust service (Tokio, subprocess management)
- Messaging: MQTT broker (pub/sub, QoS, retain flags)
- Storage: InfluxDB (time-series, tags, fields, Flux queries)
- Visualization: Grafana (dashboards, alerts, auto-refresh)
- Infrastructure: Docker Compose (reproducible, version-controlled)
This is production IoT architecture, not a hobby project.
Industry-Standard Patterns
| Pattern | Implementation | Industry Use |
|---|---|---|
| Pub/Sub messaging | MQTT with hierarchical topics | Tesla (vehicle telemetry), AWS IoT Core |
| Time-series storage | InfluxDB with tags | Uber (metrics), PayPal (monitoring) |
| Container orchestration | Docker Compose | Every cloud platform |
| Async Rust | Tokio runtime | Discord, Cloudflare, Figma |
| Structured logging | tracing with key-value pairs | Datadog, Splunk integration |
These aren’t “learning exercises” - they’re production patterns.
The Resume Impact
After Week 7+8, you can confidently claim:
- ✅ Built production IoT telemetry pipeline (sensors → dashboards)
- ✅ Designed MQTT topic hierarchies for scalable pub/sub systems
- ✅ Implemented async Rust services with Tokio runtime
- ✅ Integrated time-series databases (InfluxDB) with proper schema design
- ✅ Created Grafana dashboards with Flux queries and alerting
- ✅ Deployed multi-container applications with Docker Compose
- ✅ Handled graceful degradation and non-fatal error scenarios
- ✅ Worked with real hardware (STM32, LoRa, environmental sensors)
This is systems engineering experience.
The Learning Progression
Week 1-3: Can I make sensors talk?
    ↓
Week 5: Can I bridge LoRa to USB?
    ↓
Week 6: Can I parse this in Rust?
    ↓
Week 7: Can I publish to MQTT and InfluxDB?
    ↓
Week 8: Can I visualize everything in Grafana?
    ↓
Answer: Yes, yes, yes, yes, YES.
And more importantly: I understand why each decision was made.
Next Steps: Production Hardening
Week 7+8 is “complete” but not “production-hardened”. Optional enhancements:
Phase 4: MQTT Resilience
Offline buffering:
struct OfflineBuffer {
    queue: VecDeque<MqttMessage>,
    max_size: usize,  // 1000 messages
}

// When MQTT publish fails
if let Err(e) = mqtt_client.publish(...).await {
    offline_buffer.enqueue(message)?;  // Save for later
}

// When connection restores
while let Some(msg) = offline_buffer.dequeue() {
    mqtt_client.publish(msg).await?;
}
Exponential backoff reconnection:
let mut retry_delay = Duration::from_secs(1);

loop {
    match mqtt_client.connect().await {
        Ok(_) => break,
        Err(e) => {
            error!("MQTT connection failed: {}", e);
            tokio::time::sleep(retry_delay).await;
            retry_delay = std::cmp::min(retry_delay * 2, Duration::from_secs(60));
        }
    }
}
Phase 5: InfluxDB Batching
Instead of one write per metric:
// Current (9 individual writes)
influxdb.write_sensor("temperature", 27.6, "node1", Some("celsius")).await?;
influxdb.write_sensor("humidity", 54.1, "node1", Some("percent")).await?;
// ... 7 more writes
Batch all points:
// Future (1 batched write)
let points = vec![
    DataPoint::builder("temperature").tag("node", "node1").field("value", 27.6).build()?,
    DataPoint::builder("humidity").tag("node", "node1").field("value", 54.1).build()?,
    // ... all 9 points
];

influxdb.write_batch(points).await?;  // Single HTTP request
Benefits: Lower latency, less overhead
Phase 6: Grafana Alerts
Temperature threshold alert:
from(bucket: "telemetry")
  |> range(start: -5m)
  |> filter(fn: (r) => r._measurement == "temperature")
  |> filter(fn: (r) => r.node == "node1")
  |> mean()
  |> yield(name: "mean_temp")

// Alert if mean > 35°C for 5 minutes
Node offline alert:
from(bucket: "telemetry")
  |> range(start: -2m)
  |> filter(fn: (r) => r._measurement == "packets_received")
  |> last()
  |> elapsed()

// Alert if no data for 2 minutes
Conclusion
Week 7+8 was about completing the vision. Not just “adding MQTT” or “adding InfluxDB” but building the complete path from sensor to insight.
Technical Achievements
- ✅ MQTT broker with hierarchical topics (9 topics per packet)
- ✅ InfluxDB time-series storage (8 measurements, tags + fields)
- ✅ Grafana dashboards (2 dashboards, 11 panels, Flux queries)
- ✅ Docker infrastructure (3 services, reproducible, version-controlled)
- ✅ Non-fatal error handling (resilient to service failures)
- ✅ Live hardware testing (6+ hours uptime, zero crashes)
Architectural Achievements
- ✅ Industry-standard IoT stack (edge → gateway → broker → database → visualization)
- ✅ Proper data modeling (MQTT topics, InfluxDB schema)
- ✅ Async Rust patterns (event loop lifetime management)
- ✅ Baby steps testing (Docker networks, ephemeral containers)
- ✅ Production patterns (graceful degradation, structured logging)
The Meta-Lesson
Week 7+8 proves that learning in public, building incrementally, and following the baby steps philosophy can produce production-quality systems.
From Week 1’s “Can I blink an LED with RTIC?” to Week 8’s “Professional Grafana dashboards visualizing real sensor data from a complete IoT pipeline” - every step built on the last.
This is how systems are built. Not in one giant leap, but through relentless incremental progress with constant validation.
Resources
Code Repository
Documentation
- MQTT_INFLUX_GUIDE.md - Comprehensive MQTT + InfluxDB tutorial
- GRAFANA_SETUP_GUIDE.md - Data source configuration
- GRAFANA_DASHBOARD_GUIDE.md - Dashboard creation guide
- FINAL_SUMMARY.md - Complete session summary
Related Projects
External Resources
- MQTT 3.1.1 Specification
- InfluxDB 2.x Documentation
- Grafana Documentation
- rumqttc Crate
- influxdb2 Crate
- Flux Query Language
Author: Antony (Tony) Mapfumo
Part of: 4-Month Embedded Rust Learning Roadmap
Week: 7+8 of 16 (Combined Phase 2 Complete)
Tags: #mqtt #influxdb #grafana #docker #iot #time-series #visualization #learning-in-public