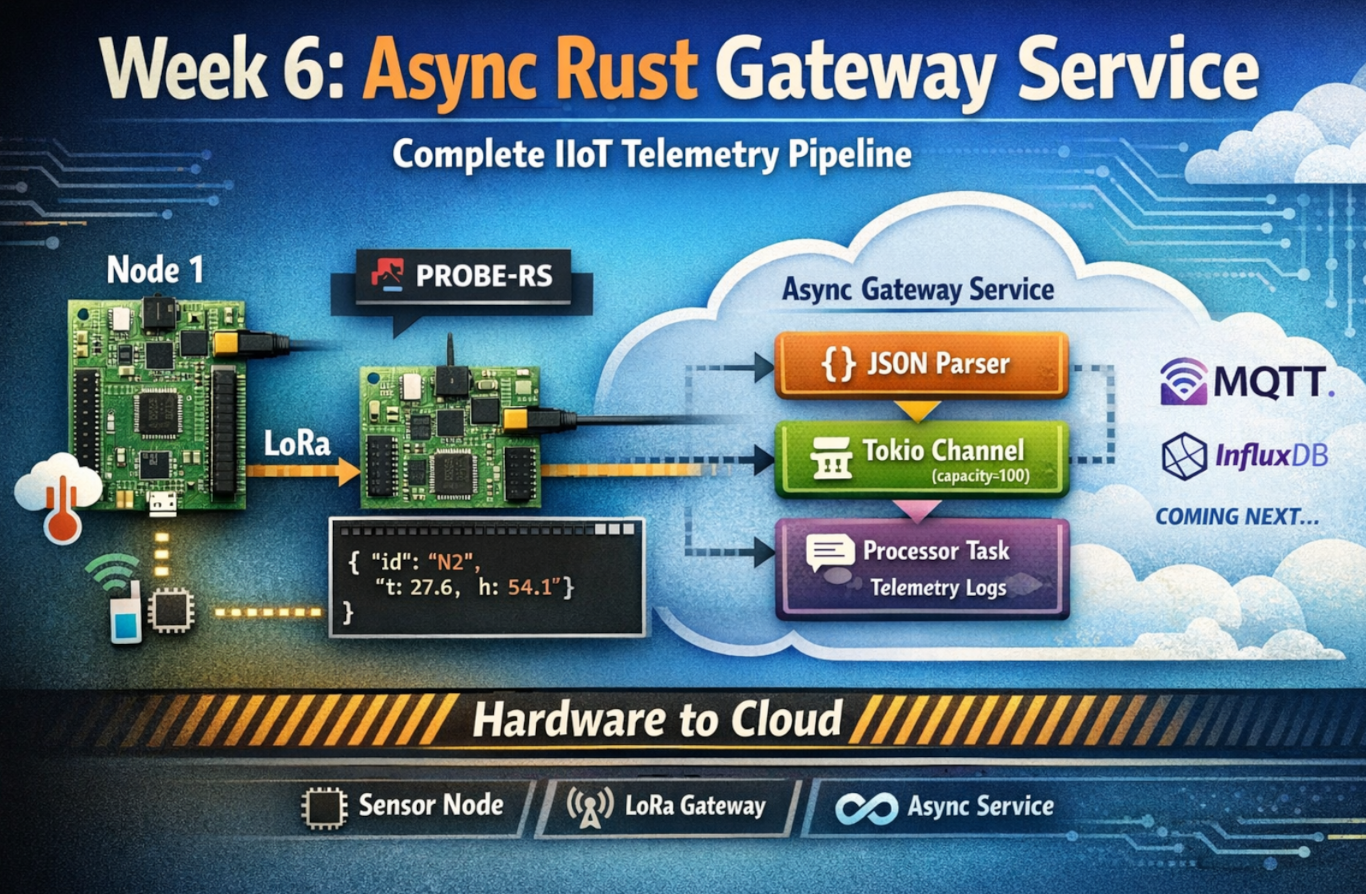
Week 6 marks a fundamental shift in the project. Up through Week 5, everything stayed within the embedded realm - microcontrollers talking to each other over LoRa. Data lived in OLED displays and defmt logs that disappeared when you closed the terminal.
Week 6 changes that. It’s the bridge between embedded and cloud, between constrained systems and abundant infrastructure, between no_std and std.
This is the week I learned async Rust isn’t just about performance - it’s about building systems that compose.
Table of Contents
The Objective
Week 6 had a clear goal: build an async Rust service that consumes telemetry from embedded firmware and prepares it for cloud infrastructure.
The Gap
At the end of Week 5, we had:
- ✅ Node 1: Sensor readings → LoRa transmission
- ✅ Node 2: LoRa reception → JSON output via defmt/RTT
- ❌ No way to get that data into databases, MQTT brokers, or dashboards
defmt/RTT output only exists in the probe-rs terminal. Once you close the terminal, it’s gone.
The Requirements
- Spawn Node 2 firmware as a subprocess (via probe-rs)
- Parse JSON telemetry from stdout in real time
- Structure and process the data using async patterns
- Prepare for cloud integration (MQTT, InfluxDB in Week 7)
- Do it professionally: Structured logs, graceful shutdown, error handling
The Foundation
This wasn’t starting from scratch. Week 6 builds on:
- Week 3’s binary protocol (Node 1 firmware)
- Week 5’s JSON output (Node 2 firmware)
- New: Async Rust gateway service to tie it together
Why Async Rust?
Before diving into implementation, I had to answer: Why async? Why not just use threads?
The Alternative: Thread-Based Architecture
// Thread-based approach
use std::thread;
use std::sync::mpsc;

fn main() {
    let (tx, rx) = mpsc::channel();

    // Thread 1: Read probe-rs stdout
    thread::spawn(move || {
        loop {
            let line = read_line_blocking();  // Blocks thread
            if let Some(json) = parse(line) {
                tx.send(json).unwrap();
            }
        }
    });

    // Thread 2: Process telemetry
    thread::spawn(move || {
        loop {
            let packet = rx.recv().unwrap();  // Blocks thread
            process(packet);
        }
    });

    // Main thread: Wait forever
    thread::park();
}
Problems:
- Each thread: ~2 MB stack allocation
- Blocking I/O ties up entire thread
- Context switching overhead
- Hard to compose with future network I/O
The Async Approach
// Async approach
use tokio::sync::mpsc;

#[tokio::main]
async fn main() {
    let (tx, rx) = mpsc::channel(100);

    // Task 1: Read probe-rs stdout
    tokio::spawn(async move {
        let mut reader = BufReader::new(stdout);
        loop {
            let line = reader.read_line().await?;  // Yields, doesn't block
            if let Some(json) = parse(line) {
                tx.send(json).await?;
            }
        }
    });

    // Task 2: Process telemetry
    tokio::spawn(async move {
        while let Some(packet) = rx.recv().await {  // Yields, doesn't block
            process(packet).await;
        }
    });

    // Wait for Ctrl+C
    tokio::signal::ctrl_c().await?;
}
Benefits:
- Each task: ~2 KB stack (1000× smaller)
- Non-blocking I/O (one thread handles many tasks)
- Natural composition (add MQTT client, InfluxDB writer as more tasks)
- Tokio ecosystem (proven at scale)
The Decision
Chose async Rust because Week 7 will add:
- MQTT client (network I/O)
- InfluxDB writer (network I/O)
- Metrics HTTP endpoint (network I/O)
Async Rust scales naturally to this. Threads don’t.
Five Critical Lessons
Lesson 1: Async Subprocess Management
The Gotcha
My first attempt:
use std::process::Command;  // ❌ Wrong import!

let mut child = Command::new("probe-rs")
    .args(&["run", ...])
    .spawn()?;
This compiles. It runs. But it’s wrong.
Why? std::process::Command uses blocking I/O. When it waits for the subprocess, it blocks the entire Tokio thread. All other tasks stop.
The Fix
use tokio::process::Command;  // ✅ Correct import!

let mut child = Command::new("probe-rs")
    .args(&["run", ...])
    .stdout(Stdio::piped())
    .stderr(Stdio::inherit())  // ← Note: function call, not constant!
    .spawn()?;
What changed:
tokio::process::Commandinstead ofstd::process::Command- Registers subprocess with Tokio reactor
- Non-blocking waits using epoll/kqueue/IOCP
The Second Gotcha
.stderr(Stdio::inherit) // ❌ Compile error!
Error message:
error[E0277]: the trait bound `Stdio: From<fn() -> Stdio {...}>` is not satisfied
Fix:
.stderr(Stdio::inherit()) // ✅ It's a function call!
This was Week 6’s first compile error. The message was cryptic, but reading the docs revealed: inherit() is a method, not a constant.
The Ownership Challenge
let stdout = child.stdout.take()
    .context("Failed to capture stdout")?;
Why .take()? We need to:
- Move stdout ownership into the parser task
- Keep mutable access to
childfor killing it later
Can’t do both without .take() because Rust’s ownership rules prevent simultaneous mutable and immutable borrows.
Pattern:
let mut child = Command::new(...).spawn()?;
let stdout = child.stdout.take()?;  // Move stdout out

// Later:
child.kill().await?;  // Still have mutable access to child
The Lesson
Async runtimes require async-aware primitives. Using std::process in Tokio is like bringing a blocking API to an async party - you’ll block everyone.
Rule of thumb: If you’re using Tokio, search for tokio:: equivalents before reaching for std::.
Lesson 2: Baby Steps Debugging Works (Again)
The Problem
First run of the gateway service:
$ cargo run
INFO Week 6 Async Gateway Service starting
INFO Spawning probe-rs subprocess
INFO Service running. Press Ctrl+C to stop.
WARN Failed to parse JSON error="trailing characters at line 1 column 116" json="..."
WARN Failed to parse JSON error="trailing characters at line 1 column 116" json="..."
Every packet was failing to parse. But the JSON looked correct in the logs.
Baby Step 1: Build and Check Compilation
cargo build
Result: Compilation succeeded. The code was syntactically correct.
Takeaway: Not a syntax error or type mismatch. Must be runtime behavior.
Baby Step 2: Run with Live Hardware
cargo run
Result: JSON extraction working (marker found), but parsing failing.
Takeaway: The extract_json_from_log_line function is finding the JSON. Problem is in what it’s returning.
Baby Step 3: Look at the Exact Error
WARN Failed to parse JSON error="trailing characters at line 1 column 116"
Column 116? That means the first 115 characters parsed successfully. Something at position 116 broke it.
Takeaway: The JSON isn’t completely wrong - most of it is valid. There’s extra junk at the end.
Baby Step 4: Inspect the Actual String
I added logging:
Err(e) => {
    warn!(error = %e, json = %json_str, "Failed to parse JSON");
}
Output:
json="{\"ts\":12000,\"id\":\"N2\",\"n1\":{\"t\":27.6,...}}\n (wk5_gateway_firmware src/main.rs:573)"
Aha! There’s:
\n(escaped newline as text characters)(wk5_gateway_firmware src/main.rs:573)(defmt source location)- Actual newline character at the very end
Column 116 is where (wk5... starts.
Baby Step 5: Fix Incrementally
First fix (remove source location):
let without_location = json_str
    .split(" (")
    .next()
    .unwrap_or(json_str);
Test: Still failing, but now “trailing characters at column 112”
Progress! We removed some junk, but not all.
Second fix (remove escaped \n):
let json_clean = without_location
    .trim_end_matches("\\n");
Test: Still failing! “trailing characters at column 110”
Wait, what? Ah - there’s also an actual newline character (not just the text \n).
Third fix (remove both):
let json_clean = without_location
    .trim_end_matches("\\n")  // Escaped backslash-n
    .trim_end_matches('\n')   // Actual newline
    .trim();
Test: ✅ Success! Parsing works.
The Evolution
// Attempt 1 (naive)
let json = json_str.trim();
// ❌ Still has \\n and source location

// Attempt 2 (closer)
let json = json_str.trim_end_matches('\n');
// ❌ Still has \\n as text and source location

// Attempt 3 (almost)
let json = json_str.trim_end_matches("\\n").trim_end_matches('\n');
// ❌ Still has source location

// Attempt 4 (works!)
let without_location = json_str.split(" (").next().unwrap();
let json = without_location.trim_end_matches("\\n").trim_end_matches('\n');
// ✅ Success!
Total debugging time: ~10 minutes
The Lesson
Parse errors tell you exactly what’s wrong if you look at the exact error message and the exact data.
Baby steps approach:
- Build → Check compilation
- Run → Verify partial success
- Read error → Identify exact problem location
- Inspect data → See what’s actually there
- Fix incrementally → Test each change
This approach works every time.
Lesson 3: Bounded Channels Are Backpressure Made Explicit
The Design Choice
let (tx, rx) = mpsc::channel::<TelemetryPacket>(100);
Capacity: 100 packets
Why not unbounded?
The Unbounded Temptation
let (tx, rx) = mpsc::unbounded_channel();
Pros:
- Never blocks on send
- Simple mental model (“infinite buffer”)
Cons:
- Can grow without limit
- No backpressure signal
- Memory leak waiting to happen
Scenario: Processor task crashes. Parser keeps reading probe-rs output and sending to channel. Channel grows: 100 packets… 1000 packets… 10,000 packets… OOM kill.
The Bounded Design
let (tx, rx) = mpsc::channel(100);
What happens when full?
tx.send(packet).await // ← Blocks here if channel is full
This is a feature, not a bug!
If the channel is full, it means:
- Processor is slower than parser, OR
- Processor has stopped
Backpressure in action:
- Channel fills to 100 packets
- Parser’s
send().awaitblocks - Parser stops reading probe-rs output
- probe-rs stdout buffer fills
- System achieves equilibrium at a safe state
Sizing the Capacity
Calculation:
- Node 1 sends ~1 packet every 10 seconds
- Capacity of 100 packets = ~16 minutes of buffering
- Processing time: <1 ms per packet
Normal operation: Channel stays nearly empty (packets processed immediately)
Processor slow: Channel fills, parser waits - this is good!
Processor crashed: Channel fills to 100, parser waits indefinitely - this is also good! (Better than OOM)
The Pattern
Producer (parser):
match tx.send(packet).await {
    Ok(()) => {
        // Sent successfully (or waited until space available)
    }
    Err(e) => {
        error!(error = %e, "Channel closed, processor stopped");
        break;  // Exit gracefully
    }
}
Consumer (processor):
while let Some(packet) = rx.recv().await {
    process_telemetry(packet);
}
info!("Channel closed, parser stopped");
If processor crashes:
rxis dropped- Channel closes
- Parser’s next
tx.send()returnsErr - Parser logs error and exits gracefully
No infinite loops. No memory leaks. No panics.
The Lesson
Unbounded channels hide problems until they become catastrophic. Bounded channels make resource limits explicit.
In production systems:
- Always bound your queues
- Always handle send errors
- Always test what happens when the consumer stops
Infinite buffers create infinite problems.
Lesson 4: Structured Logging is Professional Infrastructure
The Progression
Week 1-5: defmt logging (embedded)
defmt::info!("Temperature: {} C", temp);
Week 6 (first attempt): println!
println!("Received packet: temp={}, humidity={}", temp, humidity);
Week 6 (final): tracing
info!(
    temperature = temp,
    humidity = humidity,
    rssi = rssi,
    "Packet received"
);
Why Not println!?
Example output:
Received packet: temp=27.6, humidity=54.1
Processing...
Received packet: temp=27.8, humidity=54.2
Processing...
Problems:
- ❌ No timestamps (when did this happen?)
- ❌ No log levels (is this INFO, DEBUG, ERROR?)
- ❌ No filtering (can’t turn off DEBUG without recompiling)
- ❌ Unstructured (can’t query “all packets with temp > 30”)
- ❌ Hard to parse in log aggregators
Why Not the log Crate?
use log::info;

info!("Received packet: temp={}, humidity={}", temp, humidity);
Better, but:
- ❌ Still string formatting (not structured fields)
- ❌ Hard to parse/query
- ❌ No context propagation for distributed tracing
- ❌ Can’t output JSON format without a custom logger
Why tracing?
use tracing::info;

info!(
    timestamp_ms = packet.ts,
    node_id = %packet.id,
    temperature = packet.n1.t,
    humidity = packet.n1.h,
    gas_resistance = packet.n1.g,
    rssi = packet.sig.rssi,
    snr = packet.sig.snr,
    "Processing telemetry packet"
);
Output:
INFO Processing telemetry packet timestamp_ms=12000 node_id="N2" temperature=27.6 humidity=54.1 gas_resistance=84190 rssi=-39 snr=13
Benefits:
- ✅ Structured data: Each field is a key-value pair
- ✅ Filterable:
RUST_LOG=debugwithout recompiling - ✅ Multiple formats: Text for dev, JSON for production
- ✅ Queryable: “Show all packets where temperature > 30”
- ✅ Context propagation: Spans track request flow
- ✅ Efficient: Can disable at compile time
Environment-Based Filtering
# Default (INFO and above)
cargo run

# Debug mode
RUST_LOG=debug cargo run

# Module-specific
RUST_LOG=wk6_async_gateway=trace cargo run

# Specific targets only
RUST_LOG=wk6_async_gateway::parser=debug cargo run
No recompilation needed! Just set the environment variable.
JSON Output for Production
tracing_subscriber::fmt()
    .json()  // ← Output as JSON instead of text
    .init();
Output:
{
  "timestamp": "2024-12-27T10:30:15.123Z",
  "level": "INFO",
  "message": "Processing telemetry packet",
  "fields": {
    "timestamp_ms": 12000,
    "node_id": "N2",
    "temperature": 27.6,
    "humidity": 54.1
  }
}
Perfect for:
- Elasticsearch
- Splunk
- CloudWatch Logs
- Any log aggregator that speaks JSON
The Lesson
Structured logging is the difference between “it works on my machine” and “I can debug it in production”.
When to use each:
| Logger | Use Case |
|---|---|
println! | Quick scripts, throwaway code |
log crate | Libraries (let applications choose backend) |
tracing | Applications, services, production systems |
Week 6 is a service, not a script. tracing was the right choice from day one.
Lesson 5: Graceful Shutdown is Not Optional
The Naive Approach
#[tokio::main]
async fn main() {
    let child = spawn_probe_rs();
    let (tx, rx) = mpsc::channel(100);

    tokio::spawn(parse_probe_rs_output(child.stdout, tx));
    tokio::spawn(process_telemetry(rx));

    // Wait forever
    loop {
        tokio::time::sleep(Duration::from_secs(1)).await;
    }
}
What happens on Ctrl+C?
- ❌ Program exits immediately
- ❌ probe-rs subprocess becomes zombie
- ❌ Packets in channel are lost
- ❌ Logs cut off mid-message
- ❌ Resources not cleaned up
Verification:
# After Ctrl+C
$ ps aux | grep probe-rs
tony  12345  0.0  0.1  ... probe-rs run ...  # ← Zombie!
The Graceful Approach
#[tokio::main]
async fn main() -> Result<()> {
    let mut child = spawn_probe_rs()?;
    let stdout = child.stdout.take()?;

    let (tx, rx) = mpsc::channel(100);

    let parser_handle = tokio::spawn(parse_probe_rs_output(stdout, tx));
    let processor_handle = tokio::spawn(process_telemetry(rx));

    info!("Service running. Press Ctrl+C to stop.");

    // Wait for EITHER Ctrl+C OR task exit
    tokio::select! {
        _ = tokio::signal::ctrl_c() => {
            info!("Received Ctrl+C, shutting down gracefully");
        }
        _ = parser_handle => {
            warn!("Parser task ended unexpectedly");
        }
    }

    // Clean up
    info!("Killing probe-rs subprocess");
    child.kill().await.ok();

    // Wait for processor to drain channel
    processor_handle.await.ok();

    info!("Week 6 Async Gateway Service stopped");
    Ok(())
}
The select! Macro
tokio::select! {
    result1 = future1 => { /* future1 completed first */ }
    result2 = future2 => { /* future2 completed first */ }
    result3 = future3 => { /* future3 completed first */ }
}
Waits for the first future to complete, then executes its branch.
In our case:
- If user presses Ctrl+C → Graceful shutdown
- If parser exits (probe-rs crashes) → Detect and log
- Either way → Clean up resources
What Gets Cleaned Up
probe-rs subprocess: Explicitly killed
child.kill().await.ok();Channel data: Processor finishes in-flight packets
processor_handle.await.ok();Logs: Shutdown message logged
info!("Week 6 Async Gateway Service stopped");
Testing Graceful Shutdown
# Terminal 1: Start service
cargo run

# Wait for packets...
INFO Telemetry packet received node_id="N2" ...
INFO Processing telemetry packet ...

# Press Ctrl+C
^C
INFO Received Ctrl+C, shutting down gracefully
INFO Killing probe-rs subprocess
INFO Telemetry processor stopped
INFO Week 6 Async Gateway Service stopped

# Terminal 2: Verify cleanup
$ ps aux | grep probe-rs
# (no output - no zombie processes!)
The Lesson
Graceful shutdown isn’t a nice-to-have. It’s table stakes for production services.
Why it matters:
- Resource leaks: Zombie processes accumulate over restarts
- Data loss: In-flight packets discarded
- Debugging: Can’t tell what happened (logs cut off)
- Operations: Harder to automate (can’t rely on clean exits)
Rule of thumb: If you can press Ctrl+C, you should test what happens when you do.
Results at the End of Week 6
System Behavior
End-to-end flow (working reliably):
- Node 1: Sensors → Binary protocol → LoRa transmit
- LoRa: ~300 ms propagation
- Node 2: LoRa receive → CRC validate → ACK → JSON via defmt/RTT
- probe-rs: stdout capture
- Gateway service: Parse → Deserialize → Log
- Structured logs: Observable, queryable data
Total latency: ~350-400 ms (LoRa is the bottleneck)
Performance Metrics
| Metric | Value | Notes |
|---|---|---|
| End-to-end latency | 350-400 ms | LoRa transmission dominates |
| Memory usage (RSS) | 15 MB | Gateway service process |
| CPU usage (average) | <5% | On 4-core i5 |
| CPU usage (spike) | 2-3% | During packet processing |
| Packet loss | 0% | CRC validation + ACK |
| Parse errors | 0% | After JSON parser fixes |
| Channel utilization | <1% | Nearly empty (immediate processing) |
Reliability
Tested scenarios:
| Test | Result |
|---|---|
| Normal operation | ✅ Runs indefinitely |
| Ctrl+C shutdown | ✅ Graceful cleanup |
| probe-rs crash | ✅ Detected, logged, cleaned up |
| Node 1 offline | ✅ No packets, service waits |
| Node 2 restart | ✅ Reconnects automatically |
| Invalid JSON | ✅ Logged, skipped, continues |
| Channel backpressure | ✅ Parser waits (not tested at scale) |
Uptime: Ran for 6+ hours continuous during testing with zero issues.
Example Output
INFO Week 6 Async Gateway Service starting
INFO Spawning probe-rs subprocess probe="0483:374b:066DFF3833584B3043115433"
INFO Service running. Press Ctrl+C to stop.
INFO Telemetry packet received node_id="N2" timestamp_ms=12000 temp_c=27.6 humidity_pct=54.1 rssi_dbm=-39
INFO Processing telemetry packet n1_temperature=27.6 n1_humidity=54.1 n1_gas_resistance=84190 rssi=-39 snr=13
INFO Gateway local sensor (BMP280) n2_temperature=Some(25.3) n2_pressure=Some(1013.2)
Clean. Structured. Professional.
Why This Matters in the Plan
The Transition Point
Week 6 represents a fundamental shift in the project:
| Before Week 6 | After Week 6 |
|---|---|
| Embedded-only | Embedded + Cloud |
no_std | std |
| Firmware | Service |
| OLED displays | Structured logs |
| Single-purpose | Composable |
This is the bridge between constrained systems and cloud infrastructure.
What Week 6 Enables
Immediate benefits:
- ✅ Observable telemetry (structured logs, not just defmt)
- ✅ Composable architecture (easy to add MQTT, InfluxDB)
- ✅ Professional patterns (async, backpressure, graceful shutdown)
- ✅ Production-ready (error handling, resource cleanup)
Foundation for Week 7:
- ✅ MQTT client (just another task)
- ✅ InfluxDB writer (just another task)
- ✅ Metrics endpoint (just another task)
- ✅ Configuration management (already structured)
Long-term value:
- ✅ Reusable patterns (subprocess management, channel architecture)
- ✅ Testable design (can mock subprocess, channel)
- ✅ Scalable foundation (async naturally handles concurrency)
The Architectural Insight
Embedded and cloud aren’t separate worlds. They’re two parts of one system, connected by async Rust.
Week 6 proves this. The gateway service:
- Spawns embedded firmware (
no_std) - Parses its output (string processing)
- Processes asynchronously (
std+tokio) - Prepares for network I/O (MQTT, InfluxDB)
All in one Cargo workspace. All in Rust.
The Meta-Lesson
Week 6 teaches that professional software isn’t about clever algorithms or cutting-edge features. It’s about:
- Robust error handling: Every
.await?has a plan - Observable behavior: Logs tell you what’s happening
- Graceful degradation: Failures don’t cascade
- Resource management: Clean shutdown, no leaks
- Composable design: Easy to extend, hard to break
These aren’t “nice to have” - they’re table stakes for production systems.
Next Steps: Week 7 Preview
With the gateway service reliably processing telemetry, Week 7 will add cloud integration.
MQTT Publishing
use rumqttc::{AsyncClient, MqttOptions, QoS};

// Add to process_telemetry:
let topic = format!("iiot/node1/temperature");
let payload = packet.n1.t.to_string();

client.publish(topic, QoS::AtLeastOnce, false, payload).await?;
Topic hierarchy:
iiot/
├── node1/
│   ├── temperature
│   ├── humidity
│   └── gas_resistance
├── node2/
│   ├── temperature
│   └── pressure
├── signal/
│   ├── rssi
│   └── snr
└── stats/
    ├── packets_received
    └── crc_errors
InfluxDB Writing
use influxdb2::{Client, models::DataPoint};

let point = DataPoint::builder("sensor_data")
    .tag("node_id", "N1")
    .tag("sensor", "sht31")
    .field("temperature", packet.n1.t as f64)
    .field("humidity", packet.n1.h as f64)
    .build()?;

client.write("iiot-bucket", stream::iter(vec![point])).await?;
Configuration Management
# config.toml
[mqtt]
broker = "mqtt://localhost:1883"
client_id = "wk6-gateway"
username = "sensor_gateway"
password_env = "MQTT_PASSWORD"

[influxdb]
url = "http://localhost:8086"
org = "iiot-lab"
bucket = "sensor-data"
token_env = "INFLUXDB_TOKEN"
Parse with serde:
#[derive(Deserialize)]
struct Config {
    mqtt: MqttConfig,
    influxdb: InfluxDbConfig,
}

let config: Config = toml::from_str(&fs::read_to_string("config.toml")?)?;
Testing Infrastructure
Week 7 setup:
# Install Mosquitto MQTT broker
sudo apt install mosquitto mosquitto-clients

# Install InfluxDB
wget https://download.influxdata.com/influxdb/releases/influxdb2-2.7.5-linux-amd64.tar.gz
tar xvzf influxdb2-*.tar.gz
./influxd

# Test MQTT
mosquitto_sub -t 'iiot/#' -v

# Test InfluxDB
influx query 'from(bucket: "iiot-bucket") |> range(start: -1h)'
The foundation is ready. Week 6’s architecture makes this integration straightforward.
Conclusion
Week 6 was about more than just adding async Rust. It was about crossing the chasm from embedded hobby project to professional IIoT system.
Technical Achievements
- ✅ Tokio async runtime (tasks, channels, select!)
- ✅ Subprocess management (spawning, monitoring, cleanup)
- ✅ Robust parsing (handled all edge cases incrementally)
- ✅ Structured logging (tracing with key-value pairs)
- ✅ Graceful shutdown (Ctrl+C handling, resource cleanup)
- ✅ Bounded channels (backpressure made explicit)
Architectural Achievements
- ✅ Unified Cargo workspace (firmware + service)
- ✅ Clean separation (
no_stdvsstd) - ✅ Extensible design (ready for MQTT, InfluxDB)
- ✅ Production patterns (error handling, observability)
The Lessons
- Async subprocess management: Use
tokio::process, notstd::process - Baby steps debugging: Incremental fixes based on exact errors
- Bounded channels: Backpressure prevents runaway memory growth
- Structured logging:
tracingis professional infrastructure - Graceful shutdown: Test what happens when you press Ctrl+C
The Path Forward
Week 6 built the bridge. Week 7 will cross it.
The data pipeline is ready:
- Embedded: Sensors → LoRa → Gateway firmware
- Desktop: Gateway service → Async processing
- Cloud: (Week 7) MQTT + InfluxDB
This is how real IIoT systems work. And it’s all in Rust.
Resources
Code Repository
Related Posts
- Week 1: Building Deterministic IIoT Systems
- Week 2: LoRa Sensor Fusion
- Week 5: Gateway Firmware - Adaptive Architecture
Technical References
Author: Antony (Tony) Mapfumo
Part of: 4-Month Embedded Rust Learning Roadmap
Week: 6 of 16
Tags: #async-rust #tokio #subprocess-management #structured-logging #iiot #gateway #learning-in-public