
🎬 Watch the Full Demo
After 12 weeks of building, here’s the result: a production-grade Industrial IoT monitoring platform built from scratch.
▶️ Watch on YouTube (6 minutes)
What I Built
A complete Industrial IoT monitoring platform demonstrating expertise across the full stack:
Hardware (4 Sensor Nodes)
LoRaWAN Nodes (STM32WL55):
- LoRa-1: SHT41 temperature/humidity sensor + SSD1306 OLED
- LoRa-2: BME680 environmental sensor + SH1106 OLED
- Native LoRa radio (no external modules)
- AU915 frequency band, OTAA join
Modbus TCP Nodes (STM32F446):
- Modbus-1: SHT41 sensor + W5500 Ethernet
- Modbus-2: BME680 sensor + W5500 Ethernet
- IEEE 754 float32 register encoding
- 40001-40007 holding register map
Software Stack
Firmware: Embedded Rust + Embassy async runtime
Protocols: LoRaWAN (OTAA), Modbus TCP, MQTT
Infrastructure: Docker Compose, InfluxDB 2.x, Grafana 10.x
Gateway: RAK7268V2 WisGate Edge Lite 2
System Architecture
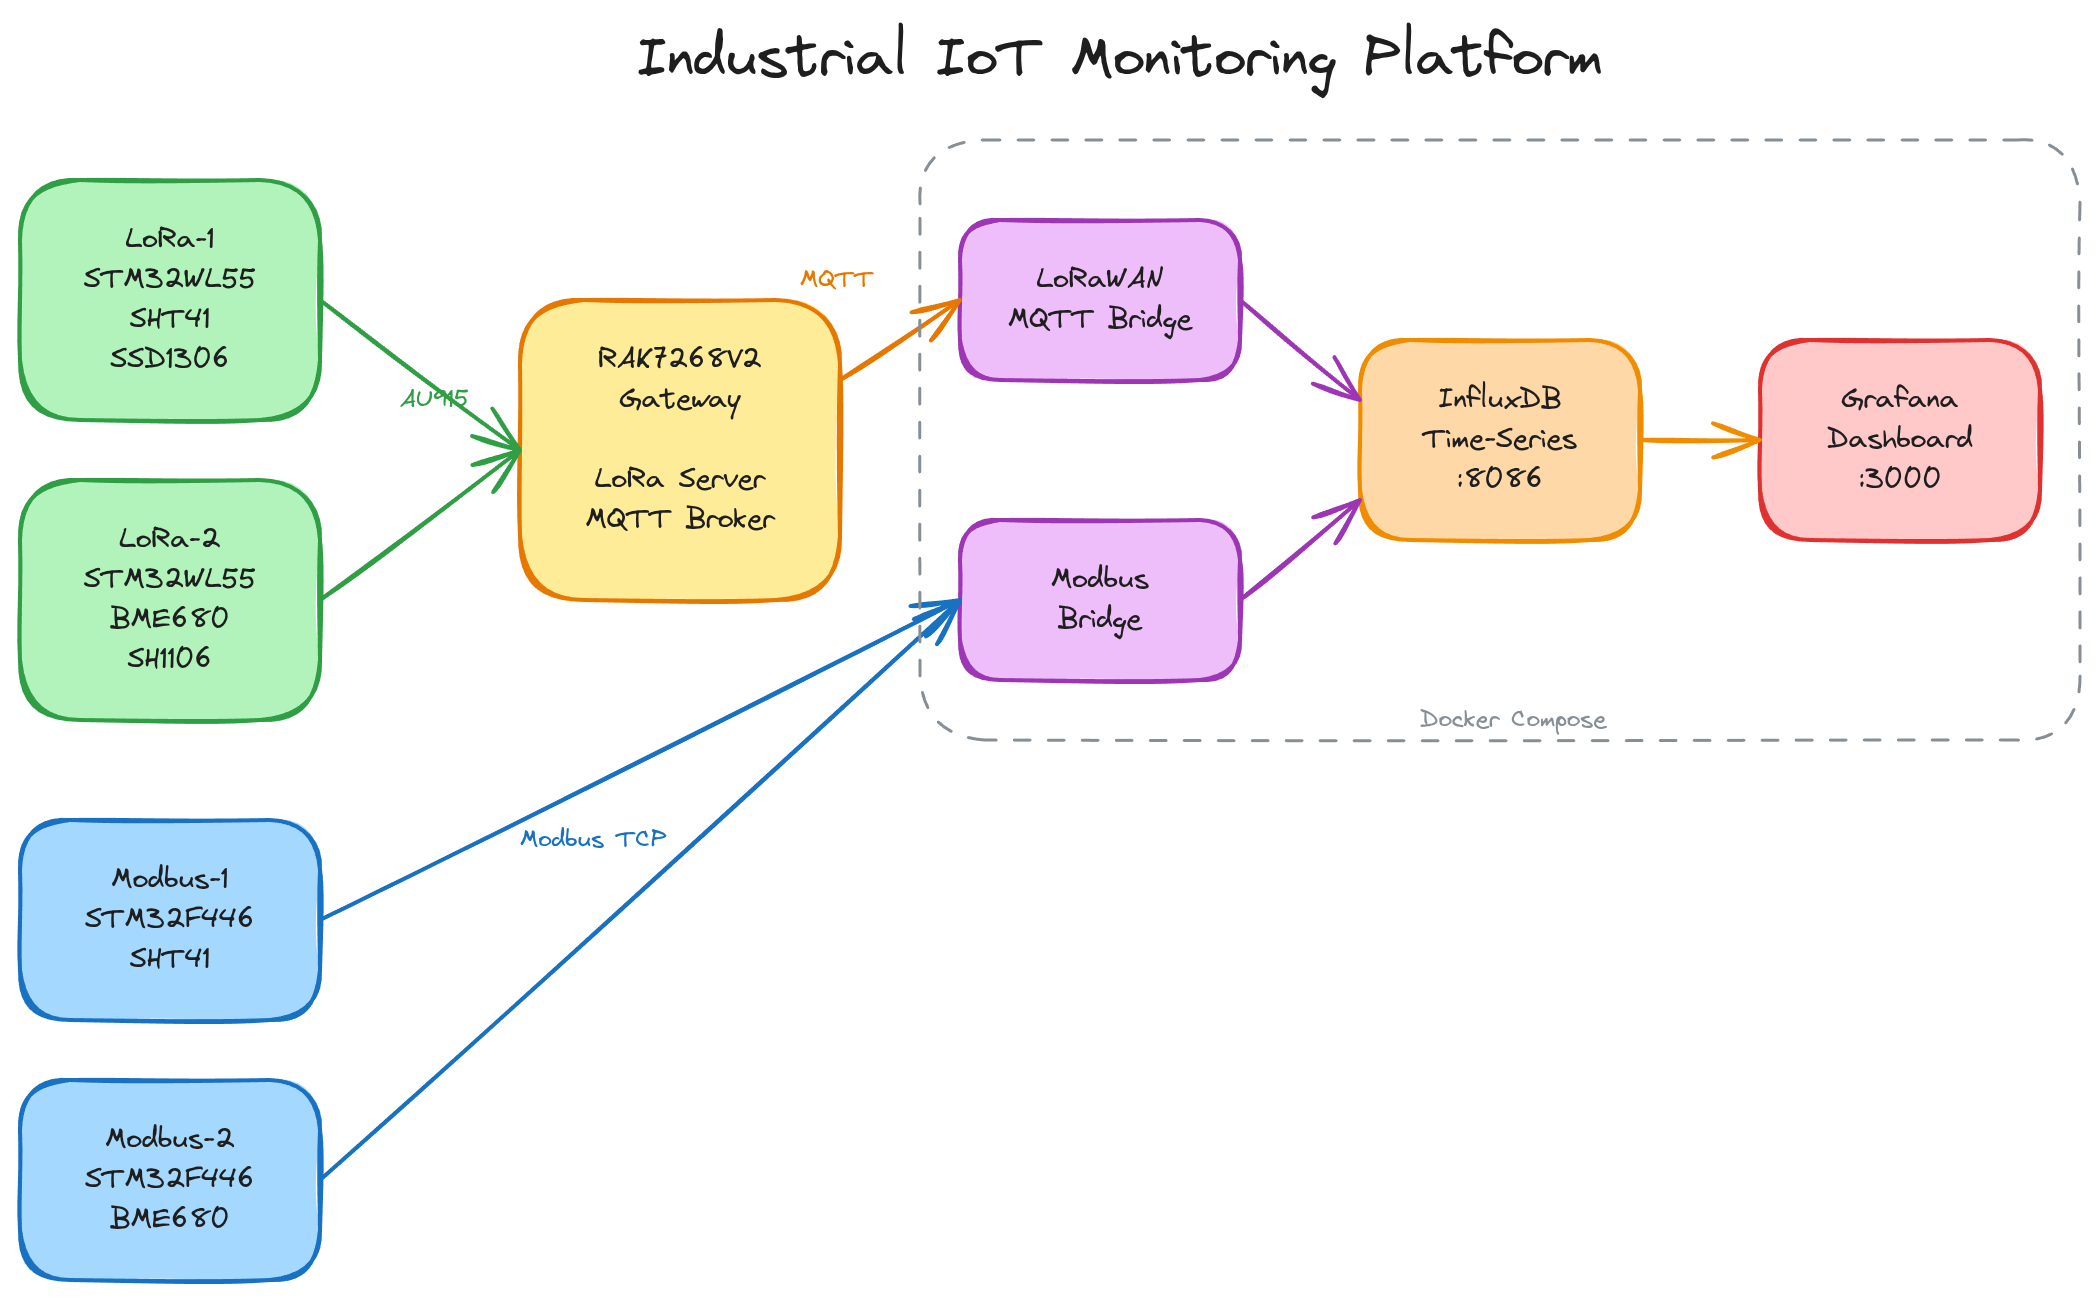
The platform integrates two industrial protocols (LoRaWAN and Modbus TCP) into a unified monitoring dashboard. Data flows from sensors through protocol-specific bridges into InfluxDB, with real-time visualization in Grafana.
Key architectural decisions:
- Embassy async framework (no RTOS overhead)
- Push-based MQTT (better fit than Prometheus pull)
- Docker Compose (reproducible infrastructure)
- Unified InfluxDB bucket with protocol tagging
View full system architecture →
Data Flow Pipeline
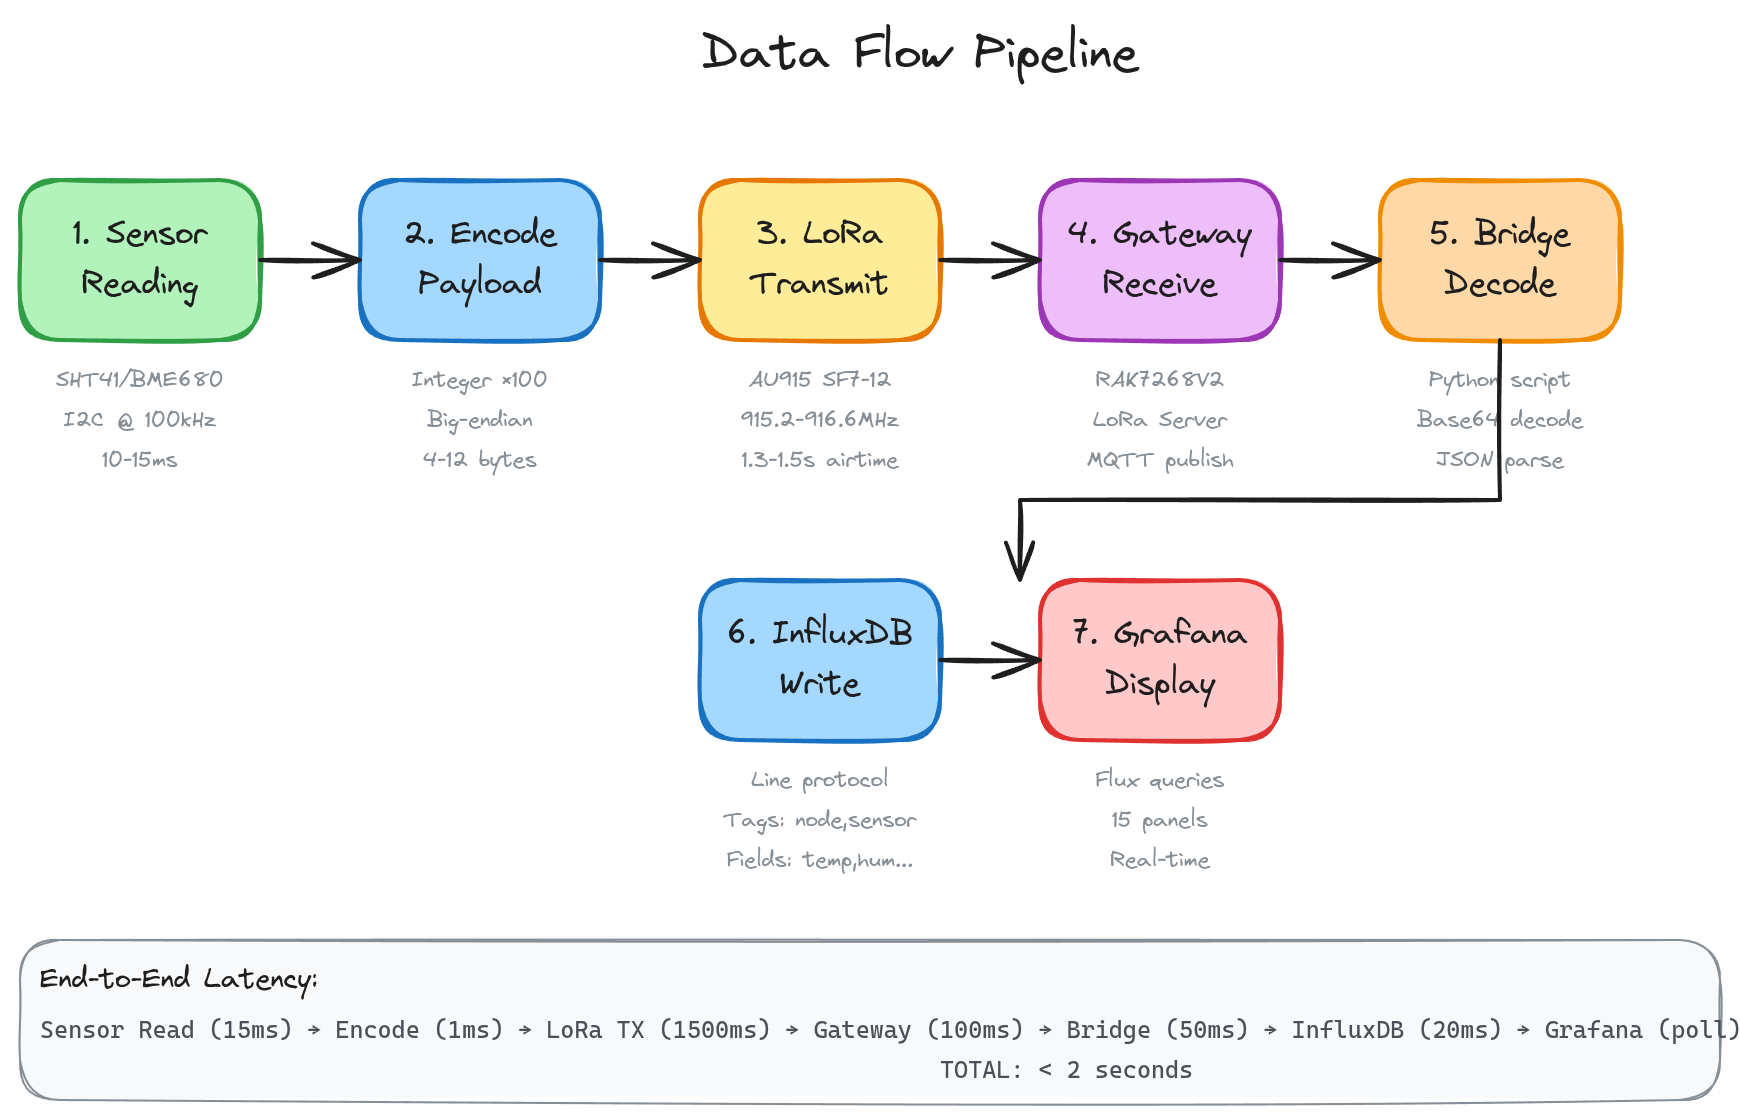
End-to-end latency: < 2 seconds
- Sensor Read (10-15ms): I2C communication with SHT41/BME680
- Encode Payload (1ms): Integer-only math, big-endian byte order
- LoRa TX (1.3-1.5s): SF7-SF12 spreading factor, 915 MHz
- Gateway Receive (<100ms): RAK7268V2 processes and publishes to MQTT
- Bridge Decode (50ms): Python script decodes Base64, parses JSON
- InfluxDB Write (20ms): Line protocol over HTTP
- Grafana Display (poll): Real-time dashboard with 15+ panels
Network Topology
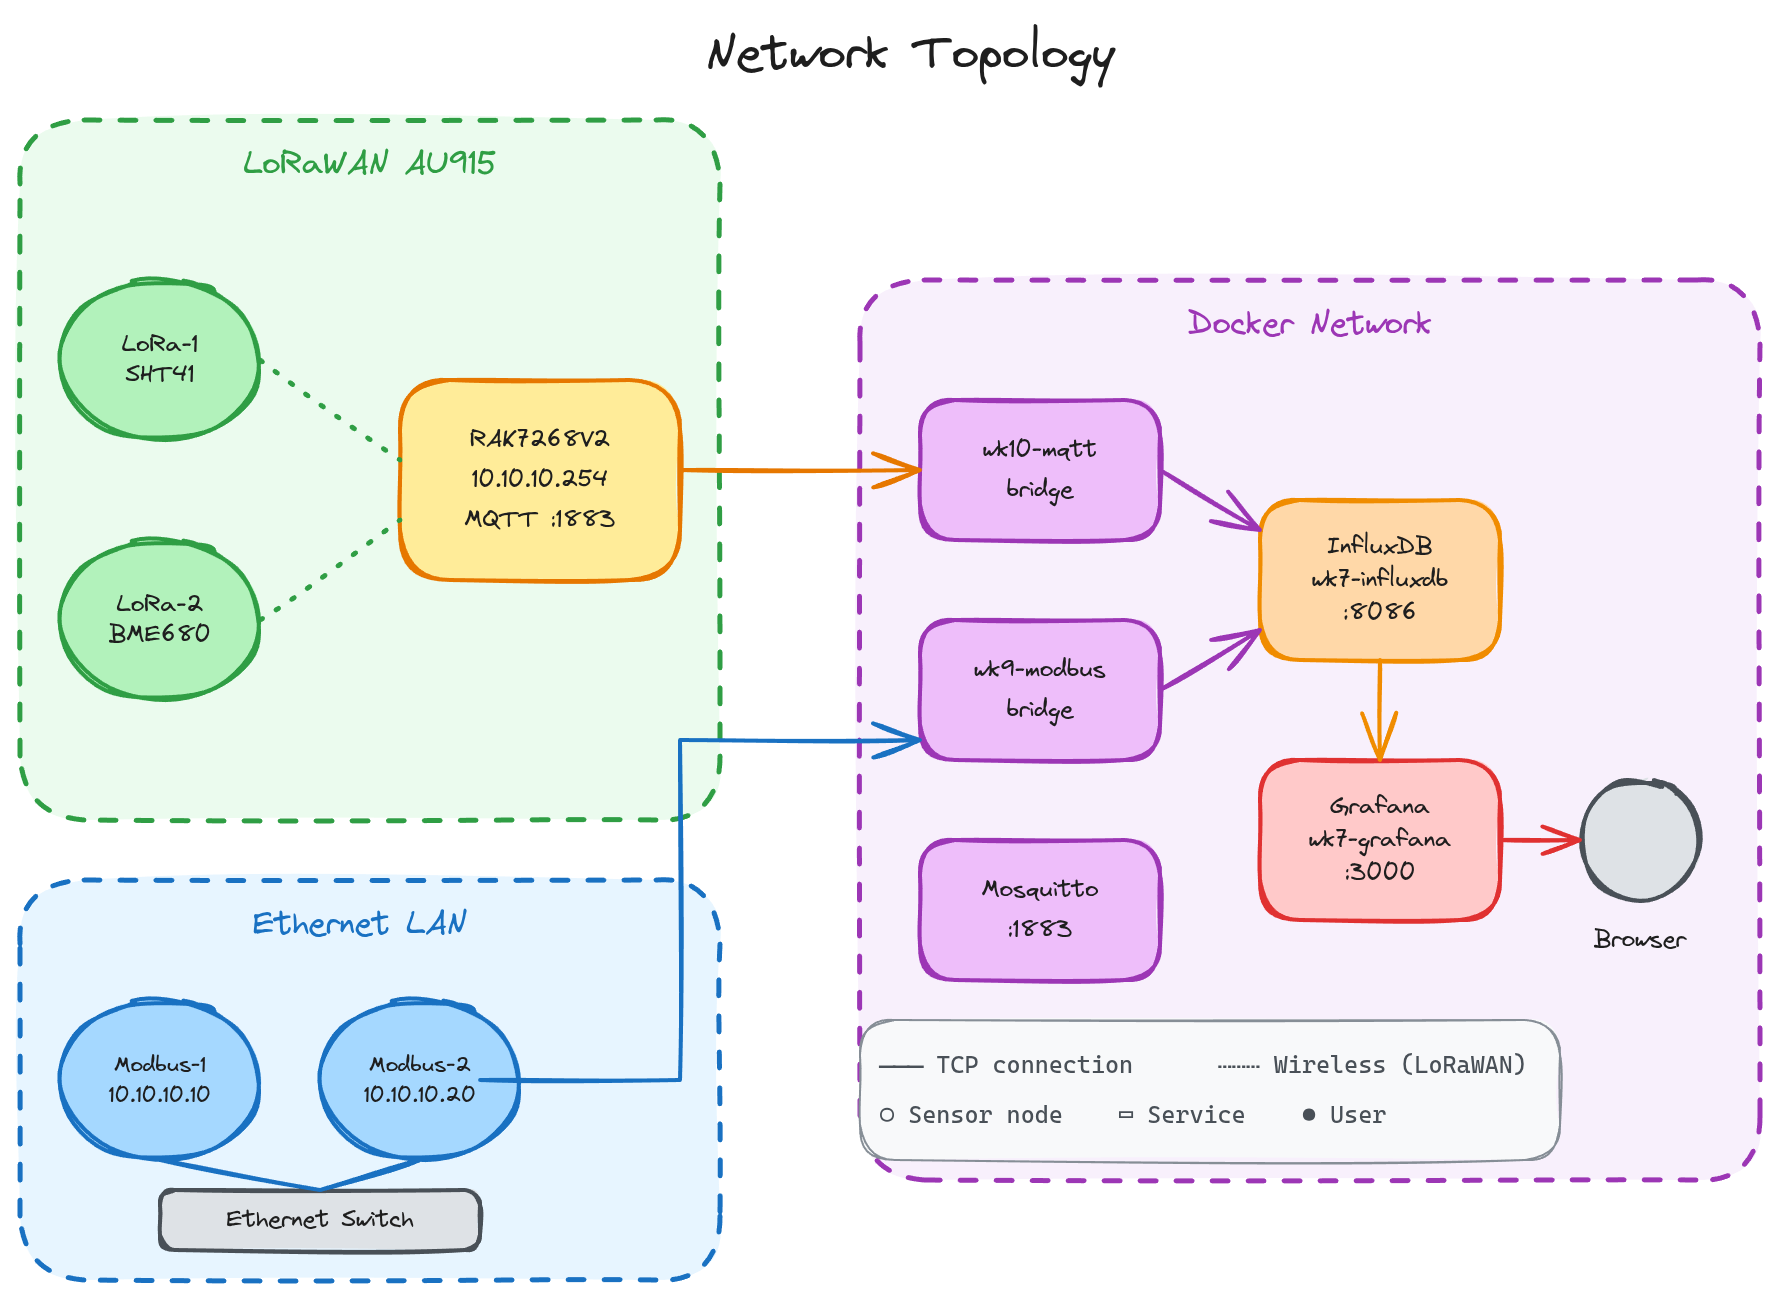
Physical layout:
- LoRaWAN: Wireless 915.2-916.6 MHz (AU915 sub-band 2)
- Modbus: Wired Ethernet (10.10.10.10, 10.10.10.20)
- Gateway: 10.10.10.254 (MQTT broker :1883)
- Docker network: Bridge mode for service isolation
Technical Highlights
1. Embassy Async Runtime (No RTOS)
Concurrent tasks without traditional RTOS overhead:
#[embassy_executor::main]
async fn main(spawner: Spawner) {
    spawner.spawn(sensor_task(sensor)).unwrap();
    spawner.spawn(display_task(display)).unwrap();
    spawner.spawn(radio_task(radio)).unwrap();
}

#[embassy_executor::task]
async fn sensor_task(mut sensor: Sht41) {
    loop {
        let reading = sensor.read().await;
        SENSOR_DATA.signal(reading);
        Timer::after_secs(30).await;
    }
}
Embassy compiles async/await into state machines - zero stack-per-task overhead.
2. LoRaWAN Byte Order Debugging
The bug: Devices wouldn’t join the network. Gateway showed wrong DevEUI.
The fix: LoRaWAN transmits EUIs little-endian, but I stored them big-endian.
// WRONG (what I initially had):
const DEV_EUI: [u8; 8] = [0x23, 0xCE, 0x1B, 0xFE, 0xFF, 0x09, 0x1F, 0xAC];

// CORRECT (reversed for LSB-first transmission):
const DEV_EUI: [u8; 8] = [0xAC, 0x1F, 0x09, 0xFF, 0xFE, 0x1B, 0xCE, 0x23];
Lesson: Always verify wire format against specification. The “obvious” byte order is often wrong.
3. Integer-Only Sensor Math (No FPU)
Challenge: STM32WL55 has no floating-point unit. Using f32 causes HardFault.
Solution: Fixed-point integer math with ×100 scaling.
// SHT41 temperature: T = -45 + (175 × raw) / 65535
fn convert_temperature(raw: u16) -> i16 {
    let temp_scaled = -4500i32 + ((17500i32 * raw as i32) / 65535);
    (temp_scaled / 100) as i16  // Result in °C × 100
}

// Payload: 2 bytes big-endian
let temp_bytes = (temp_celsius as i16).to_be_bytes();
payload[0..2].copy_from_slice(&temp_bytes);
Trade-off: 0.01°C resolution is more than sufficient for environmental monitoring.
4. Modbus TCP Server Implementation
IEEE 754 float32 encoding in holding registers:
// Write temperature (registers 40001-40002)
let temp_bytes = temp_celsius.to_be_bytes();
registers[0] = u16::from_be_bytes([temp_bytes[0], temp_bytes[1]]);
registers[1] = u16::from_be_bytes([temp_bytes[2], temp_bytes[3]]);

// Client decodes with:
// bytes = [reg_high_MSB, reg_high_LSB, reg_low_MSB, reg_low_LSB]
// float = struct.unpack('>f', bytes)
Python bridge polls every 2 seconds and writes to InfluxDB with proper tagging.
Performance Metrics
| Metric | Value |
|---|---|
| End-to-End Latency | < 2 seconds |
| LoRaWAN Join Time | ~7 seconds (OTAA) |
| LoRa TX Duration | 1.3-1.5 seconds (SF7-SF12) |
| Sensor Read Time | 10-15 ms (I2C @ 100kHz) |
| Flash Usage (STM32WL55) | 28 KB / 256 KB (11%) |
| RAM Usage (STM32WL55) | 8 KB / 64 KB (12.5%) |
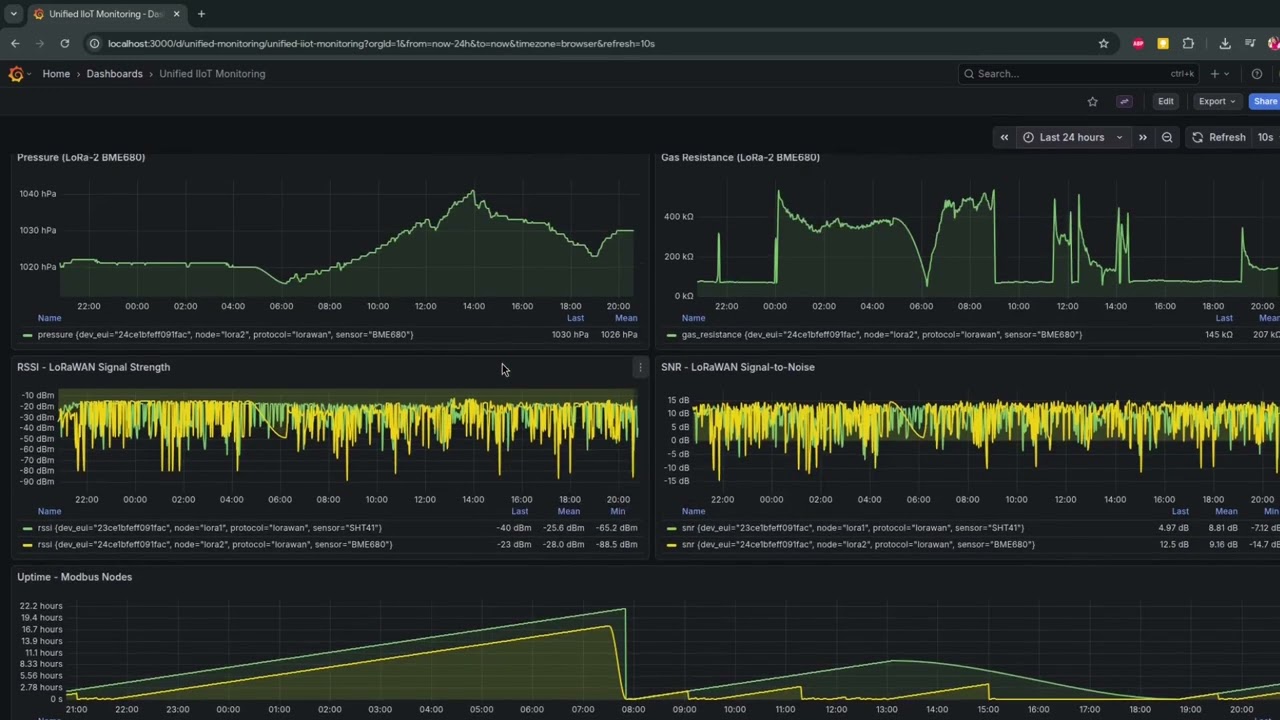
| Grafana Panels | 15+ (temperature, humidity, pressure, link quality) |
| Uptime | 72+ hours continuous operation |
Case Study & Deep Dives
I’ve documented the technical challenges, architectural decisions, and lessons learned in a comprehensive case study:
Topics covered:
- Embassy async framework internals
- LoRaWAN byte order discovery process
- Integer-only sensor math (no FPU)
- I2C peripheral sharing patterns
- Patching dependency version conflicts
- MQTT protocol version negotiation
- Architecture decision rationale
- Performance analysis
- What I’d do differently
Repository Structure
All code is open source and documented:
4-month-plan/
├── wk1-rtic-lora/           # RTIC + LoRa UART foundation
├── wk2-lora-sensor-fusion/  # Multi-sensor I2C + LoRa
├── wk3-binary-protocol/     # Postcard + CRC + ACK/retry
├── wk5-gateway-firmware/    # JSON telemetry gateway
├── wk6-async-gateway/       # Tokio async service
├── wk7-mqtt-influx/         # MQTT → InfluxDB → Grafana
├── wk9-opcua-modbus/        # W5500 + Modbus + OPC-UA
├── wk10-lorawan/            # LoRaWAN sensor network
├── wk11-unified-monitoring/ # 🌟 Self-contained unified platform
└── wk12-portfolio/          # Documentation + diagrams + video
Quick Start (Unified Platform)
The wk11-unified-monitoring repository is self-contained and deployable:
# Clone
git clone https://github.com/mapfumo/wk11-unified-monitoring
cd wk11-unified-monitoring

# Start infrastructure
docker compose up -d

# Flash firmware (requires hardware + probe-rs)
cd firmware/lorawan/lora-1 && cargo run --release
cd firmware/modbus && cargo run --release --bin modbus_1

# Access Grafana
open http://localhost:3000  # admin/admin

# Watch decoded sensor readings
python3 mqtt_subscriber.py
Requirements:
- Docker + Docker Compose
- Rust toolchain (for firmware)
- probe-rs (for flashing)
- Hardware: STM32 boards, RAK7268V2 gateway
Security Analysis
I conducted STRIDE threat modeling to identify vulnerabilities and mitigations:
Threats identified:
- Unencrypted MQTT (Tampering)
- Default credentials (Elevation of Privilege)
- No network segmentation (Lateral Movement)
- Missing TLS (Information Disclosure)
- No rate limiting (Denial of Service)
This demonstrates production-grade security thinking - not just building features, but thinking about deployment risks.
Lessons Learned
What Worked Well
- Baby steps approach: Incremental changes with verification prevented cascading failures
- Reference projects: Starting with working examples saved hours of hardware debugging
- Documentation discipline: TROUBLESHOOTING.md files paid dividends when revisiting old code
- RTT debugging: probe-rs with Real-Time Transfer is essential for embedded work
What I’d Do Differently
- Start with unified repo: Migrating firmware between repos required path fixes
- Add TLS earlier: Security should be designed in, not bolted on
- Hardware-in-the-loop CI: No automated testing for firmware
- Power profiling: Should have measured battery consumption for LoRaWAN nodes
Key Technical Insights
- Specification documents are authoritative: Blog posts omit critical details
- Embedded Rust ecosystem moves fast: Expect to patch dependencies
- Condenser mics need quiet rooms: Good choice for my timber house
- Audio quality > video quality: Viewers tolerate poor video, not poor audio
Project Statistics
| Metric | Value |
|---|---|
| Duration | 12 weeks (part-time) |
| Lines of Rust | ~3,500 |
| Lines of Python | ~800 |
| Docker Services | 6 (InfluxDB, Grafana, Mosquitto, 2× bridges, Chronograf) |
| Documentation | ~15,000 words |
| Diagrams | 3 (Excalidraw source files) |
| GitHub Repos | 10 (weekly progression + unified) |
| Blog Posts | 12 (weekly updates) |
| Video Length | 6 minutes |
| Total Investment | $130 (Fifine mic + DiCUNO LEDs) |
Technical Resources
Documentation
- README.md - Project overview
- CASE_STUDY.md - Technical deep dives
- VIDEO_SCRIPT.md - Demo video storyboard
- SECURITY.md - STRIDE analysis
Diagrams (Excalidraw Source)
Code
- wk11-unified-monitoring - Self-contained platform
- modbus_to_influx.py - Modbus bridge
- mqtt_subscriber.py - LoRaWAN decoder
Reflections
From Network Engineer to Embedded Systems Engineer
This 12-week journey proves that systematic learning + consistent shipping beats endless tutorials.
What I knew before (network engineering, 10+ years):
- TCP/IP, routing, switching
- Linux administration
- Systems thinking and troubleshooting
What I learned (embedded systems, 12 weeks):
- Bare-metal firmware in Rust
- Industrial protocols (Modbus, LoRaWAN, OPC-UA)
- Async runtimes without RTOS
- Hardware debugging (logic analyzer, probe-rs, RTT)
- Time-series databases and observability
The common thread: Systems thinking. Network engineering taught me to debug complex distributed systems - embedded systems are just smaller, closer to hardware.
The Power of Shipping
I didn’t spend 12 weeks reading books and watching videos. I spent 12 weeks building and shipping.
- Week 1: Shipped LED blink
- Week 2: Shipped sensor integration
- Week 3: Shipped binary protocol
- …
- Week 11: Shipped unified platform
- Week 12: Shipped portfolio video
Every week, something worked. That’s the difference between learning and doing.
This portfolio exists because I committed to shipping every week, no matter what.
Looking for opportunities in embedded systems, IIoT, or industrial automation.